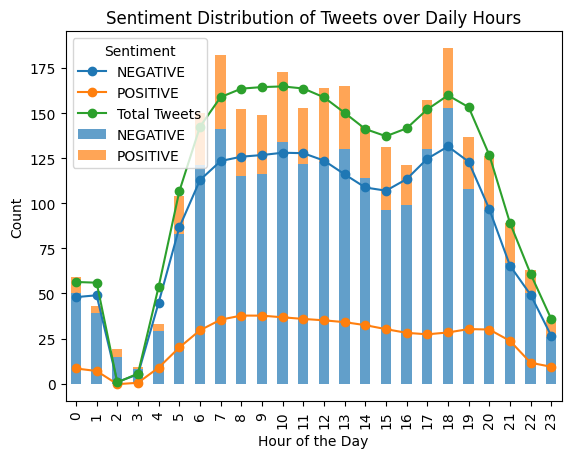
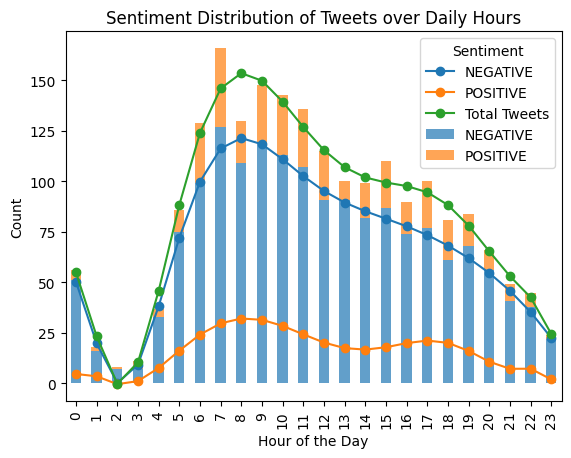
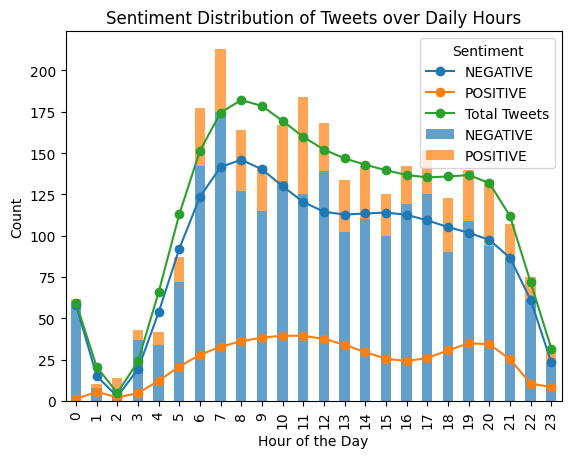
Initially, we enrich the SALTED social media data through advanced Natural Language Processing (NLP) techniques. This involves extracting sentiment from translated user posts related to traffic in the city of Madrid. Subsequently, we leverage this NGSI-LD generated sentiment data to construct a sentiment graph that illustrates how people reacted to traffic in Madrid at various times throughout the day. The sentiment graph is designed to portray sentiment scores on a scale ranging from negative to positive. It was decided to use the sentiment data in the CLIFF dashboard, so the visualizations can be shown there. This integration is an ongoing process. As an example, the graph might reveal heightened negative sentiment during morning and evening rush hours and a more positive sentiment during mid-day when traffic is comparatively lighter.
The value proposition of this idea lies in its ability to provide actionable insights and enhance decision-making processes related to urban traffic management in Madrid (or in the future, any chosen city with available data). By leveraging advanced NLP techniques to analyze sentiment from social media data, the system generates a sentiment graph. This graph not only captures the flow of public sentiment regarding traffic but also allows for an understanding of how it varies throughout the day.
The value can be summarized as follows: Informed Decision-Making: Stakeholders, such as city officials and traffic management authorities, gain valuable insights into public sentiment related to traffic conditions. This information enables them to make informed decisions about potential interventions or improvements. Monitoring: The system provides a monitoring mechanism for assessing the sentiment trends. This allows for responsiveness to emerging issues or positive developments, contributing to more agile and adaptive urban planning. Predictive Analysis: Over time, the historical sentiment data can be used for predictive analysis, helping anticipate potential traffic-related challenges during specific times or events. This proactive approach enhances overall city planning and resource allocation. User-Centric Approach: By tapping into user-generated content on social media, the system adopts a user-centric approach, directly capturing the sentiments and experiences of the city's residents. This makes the insights more relatable and reflective of the community's collective perspective.
In essence, the value proposition revolves around leveraging technology to transform social media data into actionable intelligence, fostering a smarter, more responsive, and user-centric approach to urban traffic management in Madrid.
Here we can explore the sentiment distribution of tweets throughout the daily hours in the months of April, May, and June through some visualizations and gain valuable insights into the natural distribution of tweets and identify peak hours for both positive and negative sentiments. These types of visualizations provide an overview, allowing you to discern patterns in tweet sentiments.
This application was developed by DICE Lab at IMT.
TBD
N/A
This work was supported by the European Commission CEF Programme by means of the project SALTED ‘‘Situation-Aware Linked heTerogeneous Enriched Data’’ under the Action Number 2020-EU-IA-0274.